listless@lemmy.cringecollective.io to Data is Beautiful@lemmy.worldEnglish · 10 months agoCity Street Orientation Visualizationlemmy.cringecollective.ioimagemessage-square41linkfedilinkarrow-up1242arrow-down124file-text
arrow-up1218arrow-down1imageCity Street Orientation Visualizationlemmy.cringecollective.iolistless@lemmy.cringecollective.io to Data is Beautiful@lemmy.worldEnglish · 10 months agomessage-square41linkfedilinkfile-text
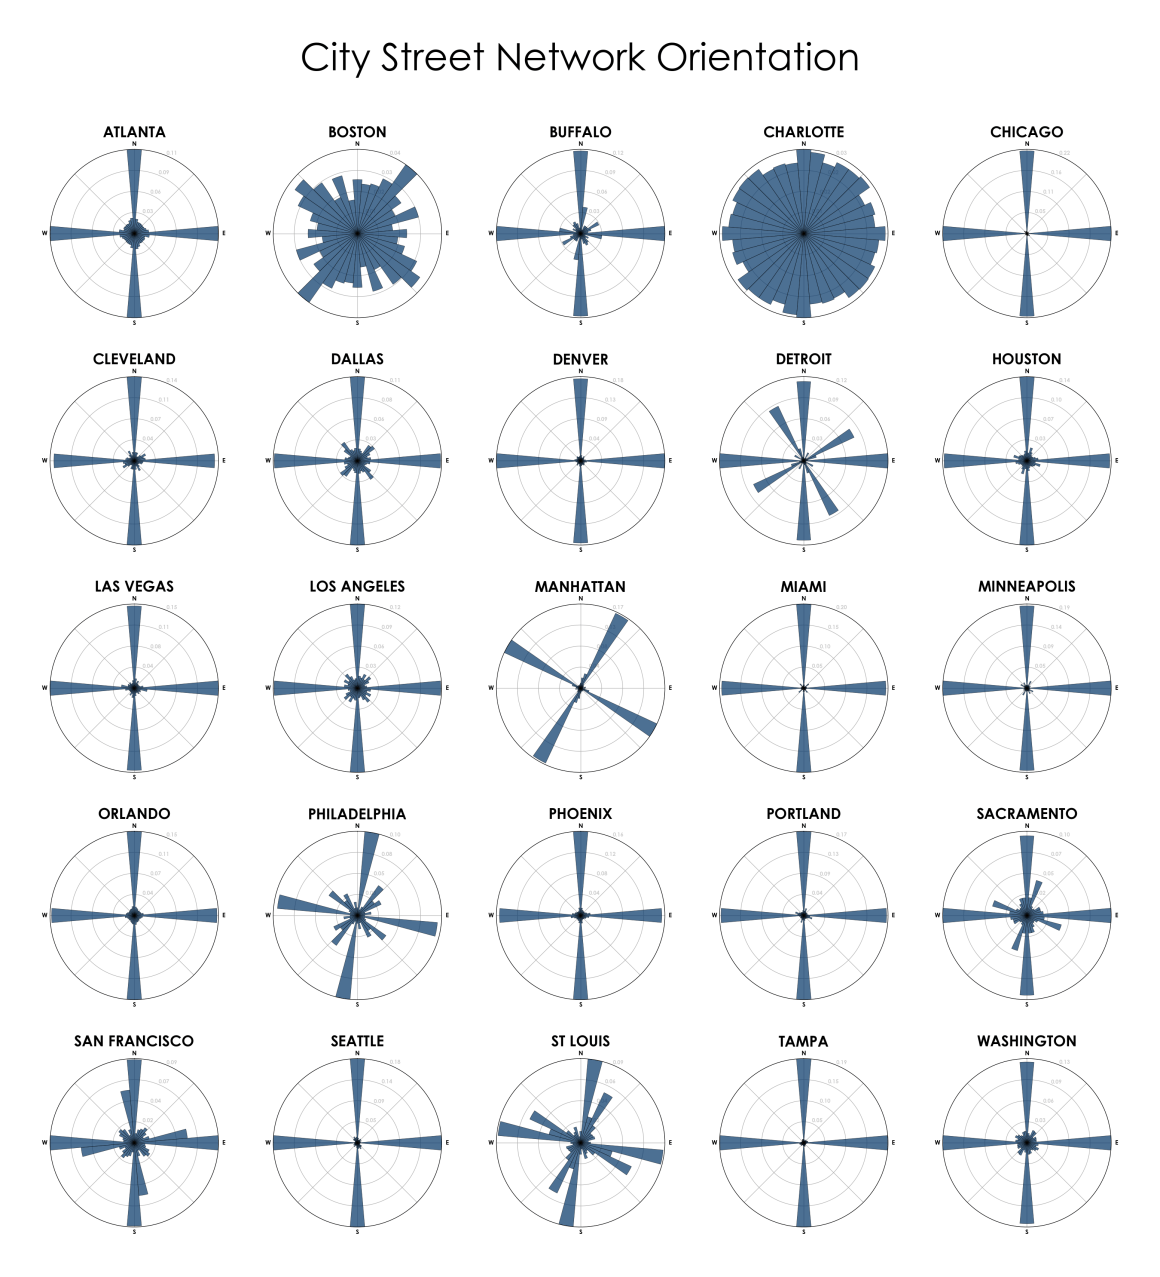
minus-squarezero_spelled_with_an_ecks@programming.devlinkfedilinkEnglisharrow-up23·10 months agoAh, that explains Boston.
minus-squarech00f@lemmy.worldlinkfedilinkEnglisharrow-up21·10 months agoThat’s what happens when a city never gets a chance to burn to the ground and start over.
minus-squareCarbonatedPastaSauce@lemmy.worldlinkfedilinkEnglisharrow-up5arrow-down1·10 months agoThere’s still time. If I ever have to drive in that city again I’ll help start the process.

Ah, that explains Boston.
That’s what happens when a city never gets a chance to burn to the ground and start over.
There’s still time.
If I ever have to drive in that city again I’ll help start the process.