111000@reddthat.com to Cool Guides@lemmy.caEnglish · 11 months agoHow to read topographic mapsreddthat.comimagemessage-square27fedilinkarrow-up135arrow-down14
arrow-up131arrow-down1imageHow to read topographic mapsreddthat.com111000@reddthat.com to Cool Guides@lemmy.caEnglish · 11 months agomessage-square27fedilink
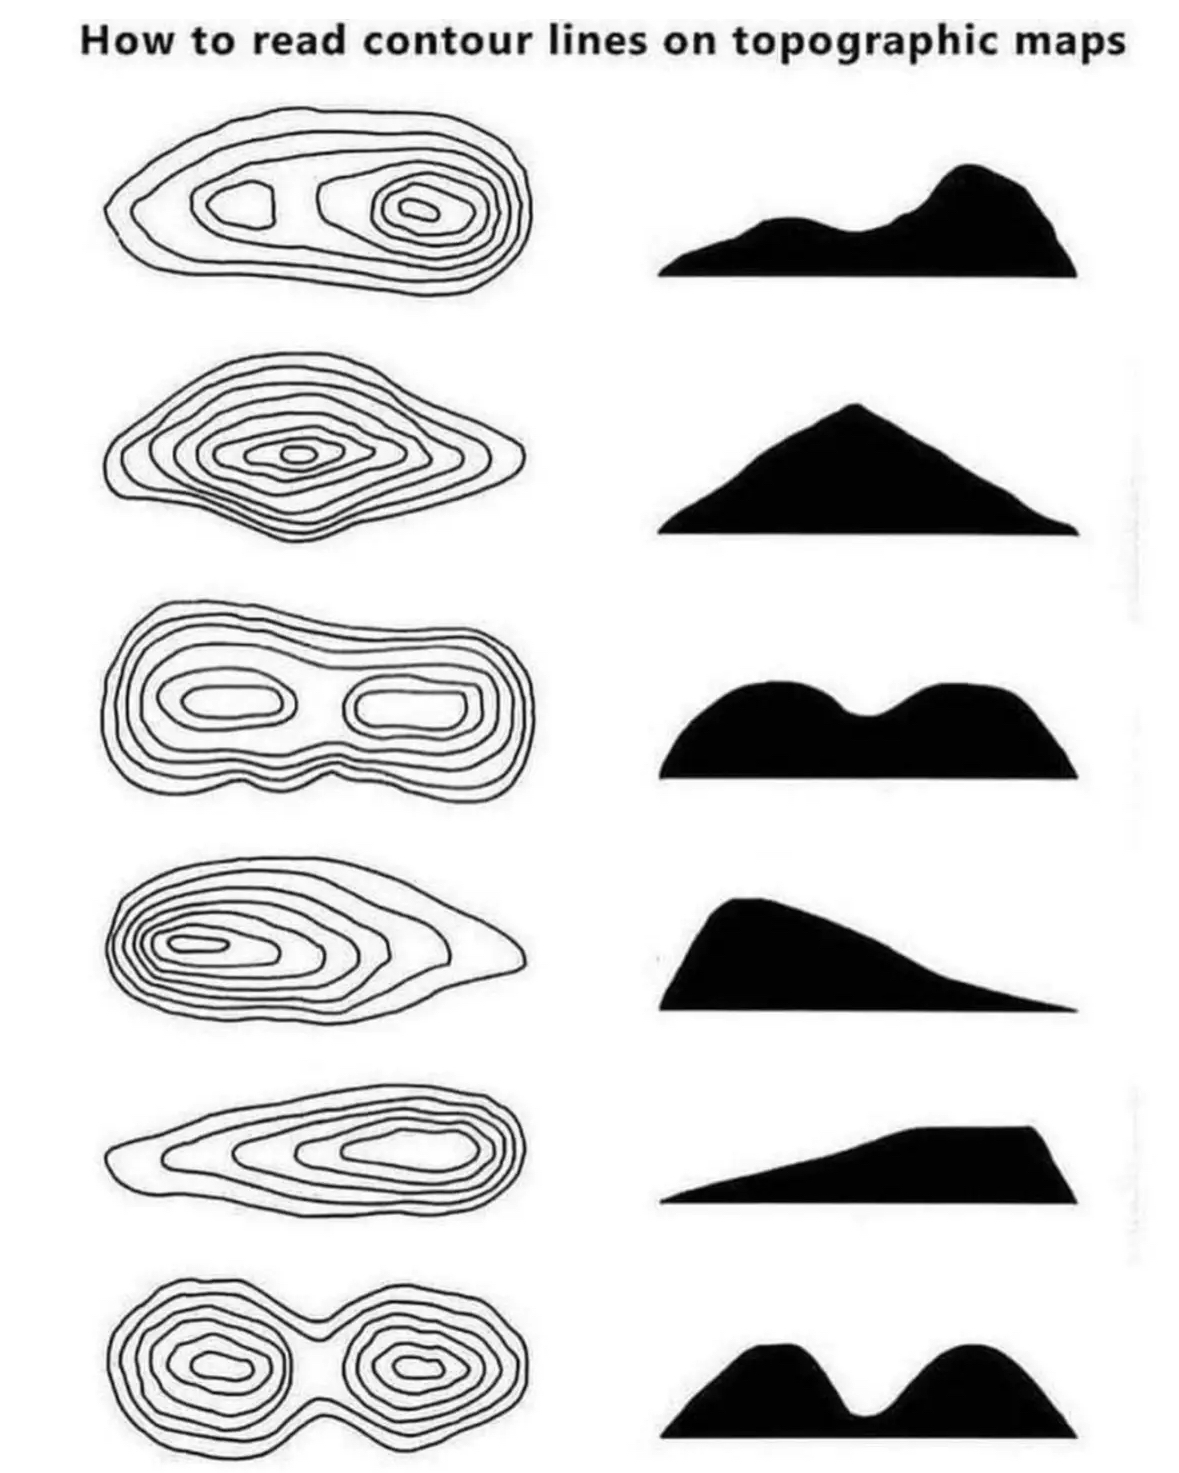
minus-squaresixCats@lemmy.dbzer0.comlinkfedilinkEnglisharrow-up7·11 months agoExcept all of the hills could be valleys, you need to see the numbers on the contours
minus-squaremeyotch@slrpnk.netlinkfedilinkEnglisharrow-up5·11 months agoIf it were a local depression instead of a hill, the lines would be hatch-marked on the side pointing into to depression.
minus-squareBCsven@lemmy.calinkfedilinkEnglisharrow-up3·11 months agoDo you have an example, I either never have seen this or never had a depression on a map
minus-squareIlliterate Domine@infosec.publinkfedilinkEnglisharrow-up2·11 months agoHere’s a slide describing how depressions are represented, and here is a topographical map of a sinkhole showing the hashes. That said, I had to look pretty hard for a map with those marks. Numbers are much more common.
minus-squareBCsven@lemmy.calinkfedilinkEnglisharrow-up1·11 months agoAh, awesome. i appreciate you taking the time to put this together. I dont recall these on maps, but as you said numbers are common. And i typically use the topomap with shading, so shading helps with understanding the terrain
minus-squaremisterdoctor@lemmy.worldlinkfedilinkEnglisharrow-up1·11 months agoYou want an example of local depression just swing by my place anytime
minus-squaresixCats@lemmy.dbzer0.comlinkfedilinkEnglisharrow-up1·11 months agoThat’s interesting, ordinance survey (in the UK) don’t do that, so it isn’t a universal standard In the UK, you have to notice that the heights are reducing

Except all of the hills could be valleys, you need to see the numbers on the contours
If it were a local depression instead of a hill, the lines would be hatch-marked on the side pointing into to depression.
Do you have an example, I either never have seen this or never had a depression on a map
Here’s a slide describing how depressions are represented, and here is a topographical map of a sinkhole showing the hashes.
That said, I had to look pretty hard for a map with those marks. Numbers are much more common.
Ah, awesome. i appreciate you taking the time to put this together. I dont recall these on maps, but as you said numbers are common. And i typically use the topomap with shading, so shading helps with understanding the terrain
You want an example of local depression just swing by my place anytime
heyoooo!
That’s interesting, ordinance survey (in the UK) don’t do that, so it isn’t a universal standard
In the UK, you have to notice that the heights are reducing