
- cross-posted to:
- technology@lemmy.ml
- cross-posted to:
- technology@lemmy.ml
Previous posts: https://programming.dev/post/3974121 and https://programming.dev/post/3974080
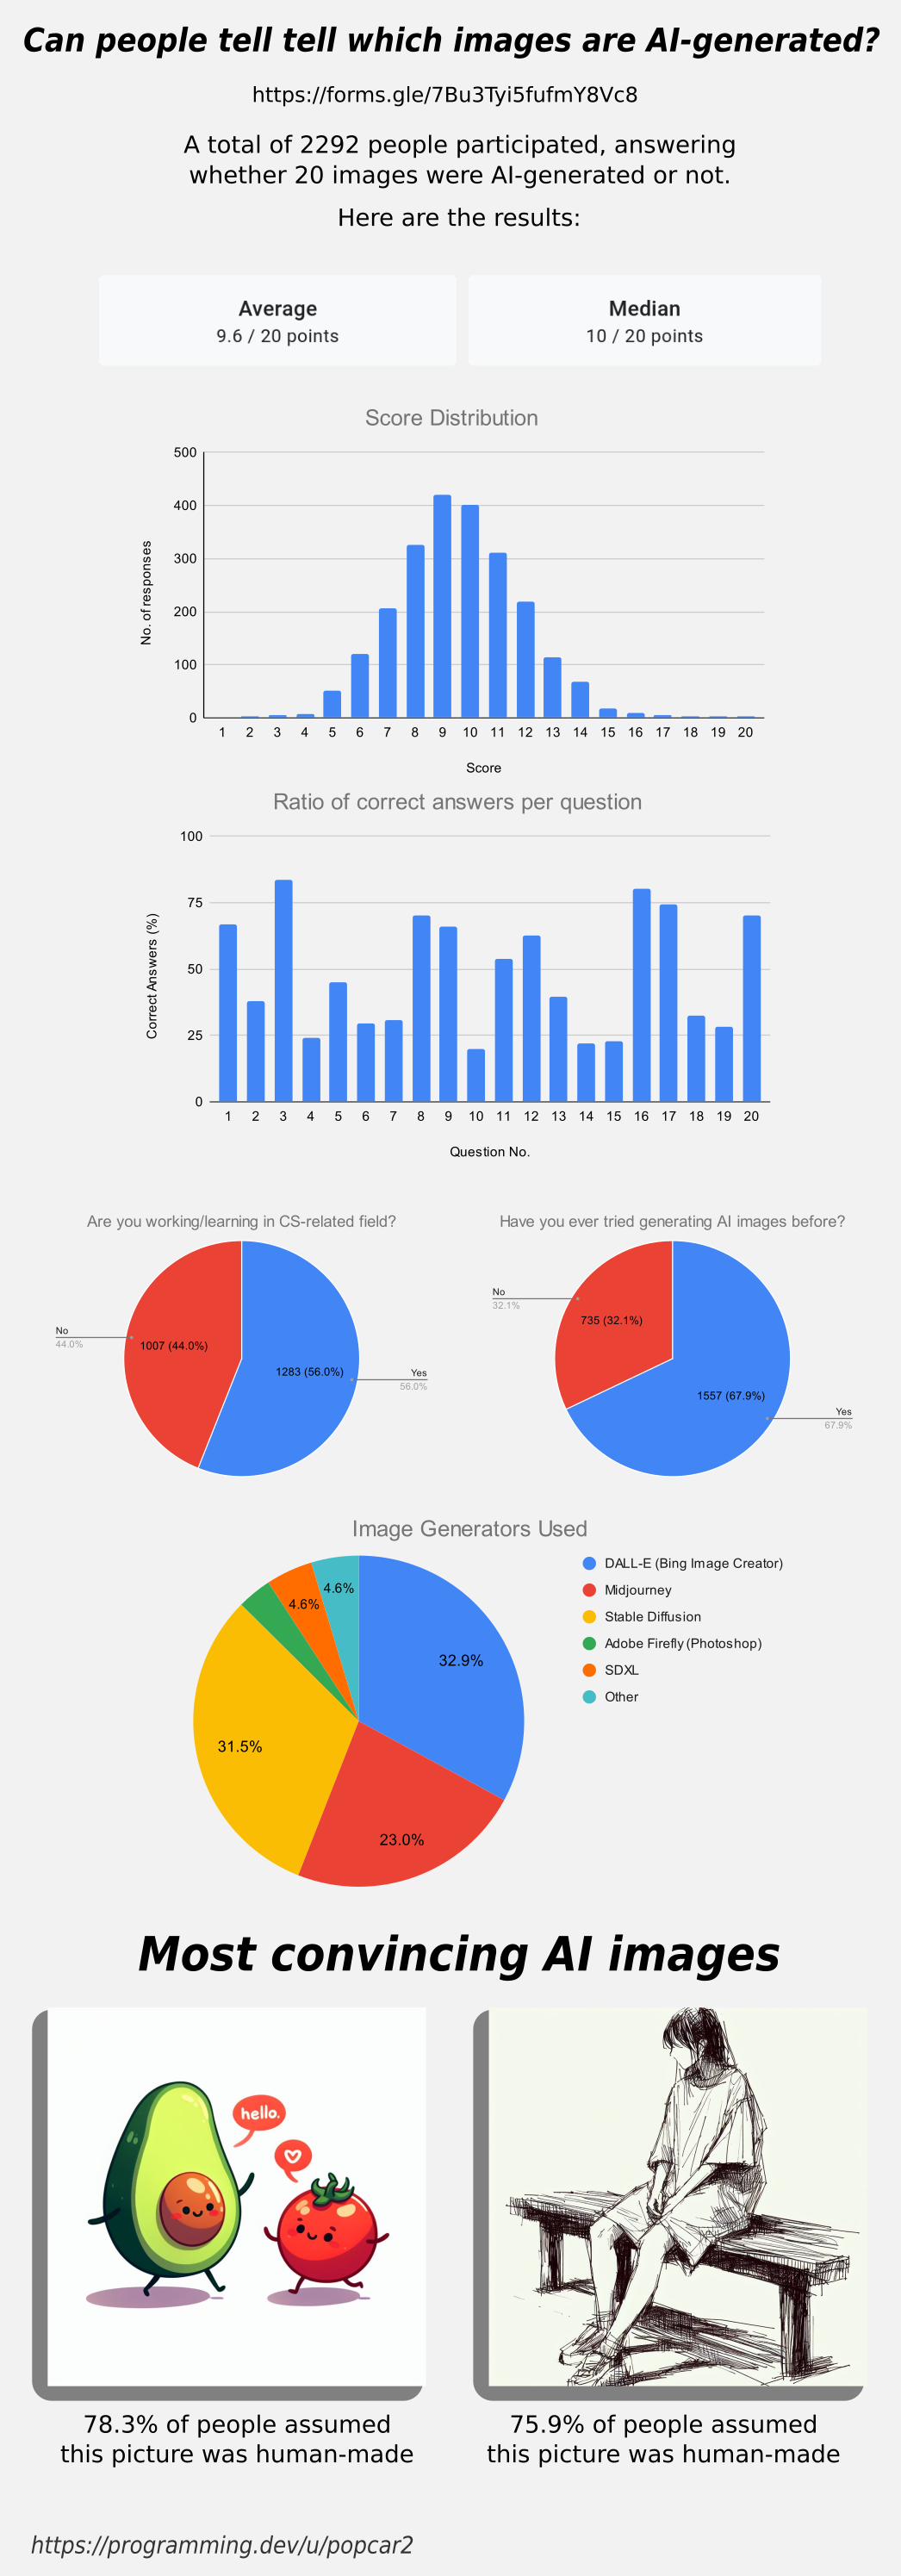
Original survey link: https://forms.gle/7Bu3Tyi5fufmY8Vc8
Thanks for all the answers, here are the results for the survey in case you were wondering how you did!
Edit: People working in CS or a related field have a 9.59 avg score while the people that aren’t have a 9.61 avg.
People that have used AI image generators before got a 9.70 avg, while people that haven’t have a 9.39 avg score.
If you look at the ratios of each picture, you’ll notice that there are roughly two categories: hard and easy pictures. Based on information like this, OP could fine tune a more comprehensive questionnaire to include some photos that are clearly in between. I think it would be interesting to use this data to figure out what could make a picture easy or hard to identify correctly.
My guess is that a picture is easy if it has fingers or logical structures such as text, railways, buildings etc. while illustrations and drawings could be harder to identify correctly. Also, some natural structures such as coral, leaves and rocks could be difficult to identify correctly. When an AI makes mistakes in those areas, humans won’t notice them very easily.
The number of easy and hard pictures was roughly equal, which brings the mean and median values close to 10/20. If you want to bring that value up or down, just change the number of hard to identify pictures.